What if you invested $1,000 in Target in 2010? (Inflation-Adjusted)
TGT · Consumer · Adjusted to 2026 dollars using BLS CPI-U data
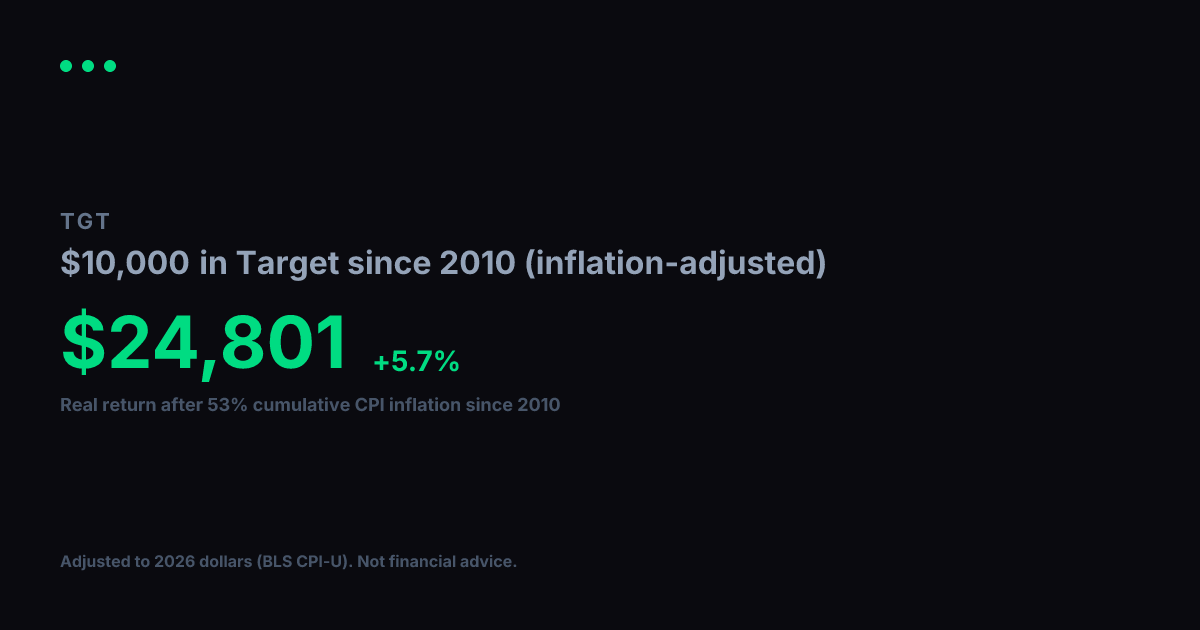
View nominal (non-adjusted) versionTarget turned $1,000 into $4,035 between 2010 and today. Impressive on paper, but inflation over that span came to 53% (BLS CPI-U). Adjusted for that erosion in purchasing power, your real gain in constant 2010 dollars is $2,637, which works out to a +6.0% annualized real growth rate over 17 years.
Nominal final value
$4,035
+303.5% total return
Real value (2010 dollars)
$2,637
+163.7% real total return
Real annualized return
+6.0%
vs. +8.8% nominal annualized
Year-by-Year (Inflation-Adjusted)
$1,000 in Target since 2010, values in constant 2010 dollars
| Year | Nominal Value | Real Value (2010 $) |
|---|---|---|
| 2010 | $1,000 | $1,000 |
| 2011 | $1,087 | $1,044 |
| 2012 | $1,029 | $968 |
| 2013 | $1,251 | $1,153 |
| 2014 | $1,201 | $1,091 |
| 2015 | $1,611 | $1,464 |
| 2016 | $1,631 | $1,460 |
| 2017 | $1,500 | $1,313 |
| 2018 | $1,823 | $1,549 |
| 2019 | $1,829 | $1,518 |
| 2020 | $2,862 | $2,339 |
| 2021 | $4,778 | $3,716 |
| 2022 | $5,893 | $4,198 |
| 2023 | $4,699 | $3,225 |
| 2024 | $3,920 | $2,613 |
| 2025 | $4,002 | $2,616 |
| 2026 | $3,196 | $2,089 |
Inflation adjustment uses BLS CPI-U annual data, deflated to 2026 dollars. Nominal stock data from Yahoo Finance (split-adjusted closing prices). Real values are expressed in constant 2010 purchasing-power dollars. For informational and educational purposes only. Not financial advice. Past performance does not guarantee future results. See our methodology and full disclaimer.