What if you invested $1,000 in Thermo Fisher in 2010? (Inflation-Adjusted)
TMO · Healthcare · Adjusted to 2026 dollars using BLS CPI-U data
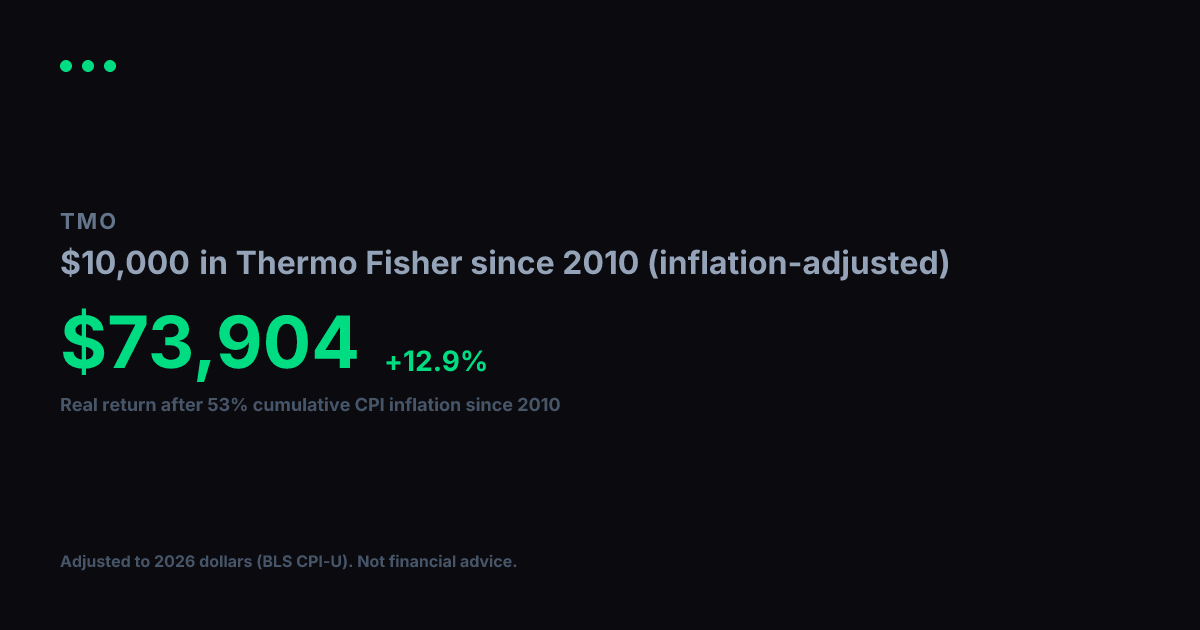
View nominal (non-adjusted) versionThermo Fisher turned $1,000 into $11,483 between 2010 and today. Impressive on paper, but inflation over that span came to 53% (BLS CPI-U). Adjusted for that erosion in purchasing power, your real gain in constant 2010 dollars is $7,505, which works out to a +12.9% annualized real growth rate over 17 years.
Nominal final value
$11,483
+1048.3% total return
Real value (2010 dollars)
$7,505
+650.5% real total return
Real annualized return
+12.9%
vs. +15.9% nominal annualized
Year-by-Year (Inflation-Adjusted)
$1,000 in Thermo Fisher since 2010, values in constant 2010 dollars
| Year | Nominal Value | Real Value (2010 $) |
|---|---|---|
| 2010 | $1,000 | $1,000 |
| 2011 | $1,241 | $1,192 |
| 2012 | $1,146 | $1,079 |
| 2013 | $1,578 | $1,454 |
| 2014 | $2,536 | $2,304 |
| 2015 | $2,771 | $2,517 |
| 2016 | $2,936 | $2,629 |
| 2017 | $3,402 | $2,980 |
| 2018 | $5,021 | $4,266 |
| 2019 | $5,520 | $4,582 |
| 2020 | $7,056 | $5,764 |
| 2021 | $11,510 | $8,952 |
| 2022 | $13,153 | $9,371 |
| 2023 | $12,934 | $8,876 |
| 2024 | $12,255 | $8,170 |
| 2025 | $13,629 | $8,908 |
| 2026 | $13,239 | $8,653 |
Inflation adjustment uses BLS CPI-U annual data, deflated to 2026 dollars. Nominal stock data from Yahoo Finance (split-adjusted closing prices). Real values are expressed in constant 2010 purchasing-power dollars. For informational and educational purposes only. Not financial advice. Past performance does not guarantee future results. See our methodology and full disclaimer.