What if you invested $1,000 in Total Bond Market (BND) in 2010? (Inflation-Adjusted)
BND · Bond · Adjusted to 2026 dollars using BLS CPI-U data
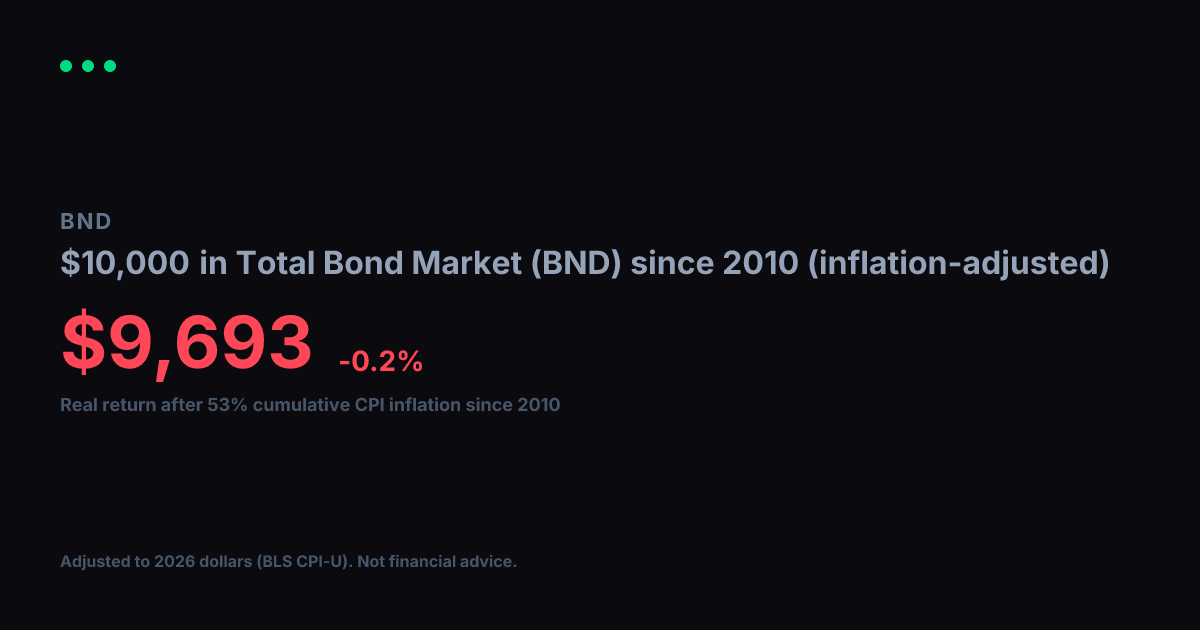
View nominal (non-adjusted) versionTotal Bond Market (BND) turned $1,000 into $1,491 between 2010 and today. Impressive on paper, but inflation over that span came to 53% (BLS CPI-U). Adjusted for that erosion in purchasing power, your real gain in constant 2010 dollars is $975, which works out to a -0.2% annualized real growth rate over 17 years.
Nominal final value
$1,491
+49.1% total return
Real value (2010 dollars)
$975
-2.5% real total return
Real annualized return
-0.2%
vs. +2.4% nominal annualized
Year-by-Year (Inflation-Adjusted)
$1,000 in Total Bond Market (BND) since 2010, values in constant 2010 dollars
| Year | Nominal Value | Real Value (2010 $) |
|---|---|---|
| 2010 | $1,000 | $1,000 |
| 2011 | $1,049 | $1,008 |
| 2012 | $1,139 | $1,072 |
| 2013 | $1,157 | $1,066 |
| 2014 | $1,158 | $1,052 |
| 2015 | $1,236 | $1,123 |
| 2016 | $1,228 | $1,100 |
| 2017 | $1,246 | $1,092 |
| 2018 | $1,278 | $1,086 |
| 2019 | $1,310 | $1,087 |
| 2020 | $1,438 | $1,175 |
| 2021 | $1,505 | $1,171 |
| 2022 | $1,459 | $1,040 |
| 2023 | $1,338 | $918 |
| 2024 | $1,366 | $911 |
| 2025 | $1,395 | $912 |
| 2026 | $1,488 | $973 |
Inflation adjustment uses BLS CPI-U annual data, deflated to 2026 dollars. Nominal stock data from Yahoo Finance (split-adjusted closing prices). Real values are expressed in constant 2010 purchasing-power dollars. For informational and educational purposes only. Not financial advice. Past performance does not guarantee future results. See our methodology and full disclaimer.