What if you invested $1,000 in Total Bond Market (BND) in 2015? (Inflation-Adjusted)
BND · Bond · Adjusted to 2026 dollars using BLS CPI-U data
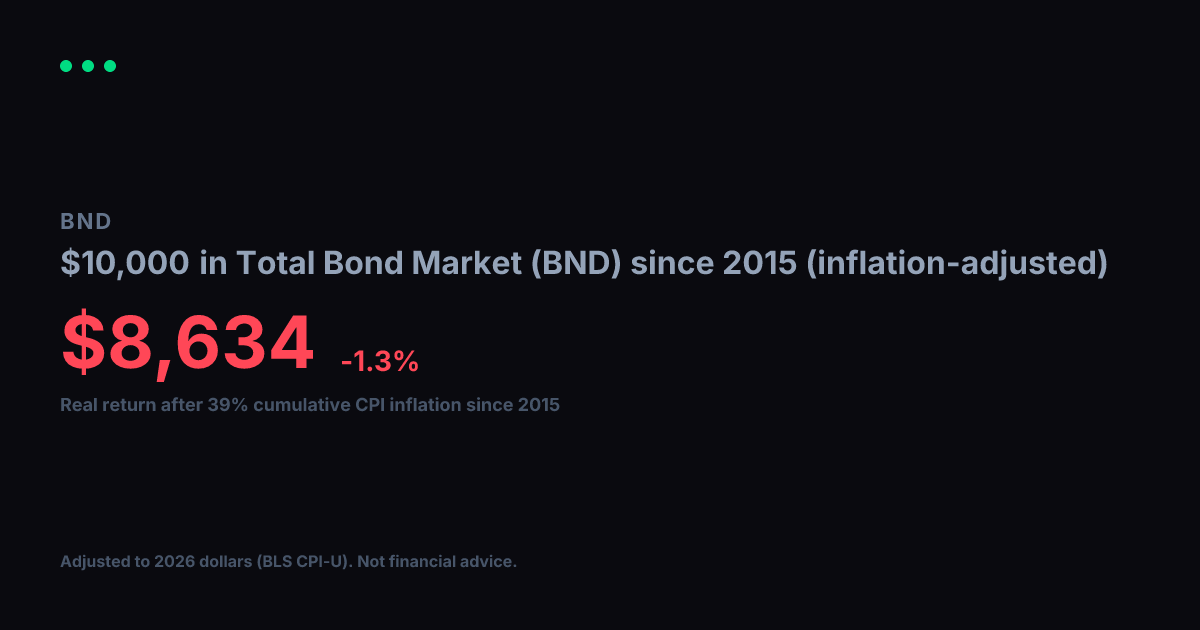
View nominal (non-adjusted) versionNominal returns can be misleading over long periods. $1,000 in Total Bond Market (BND) in 2015 became $1,207 by 2026. Over those 12 years, cumulative CPI inflation reached 39% (BLS CPI-U). Restating the return in constant purchasing power, the real value of your gain in 2015 dollars is $868, a real annualized return of -1.2%.
Nominal final value
$1,207
+20.7% total return
Real value (2015 dollars)
$868
-13.2% real total return
Real annualized return
-1.2%
vs. +1.6% nominal annualized
Year-by-Year (Inflation-Adjusted)
$1,000 in Total Bond Market (BND) since 2015, values in constant 2015 dollars
| Year | Nominal Value | Real Value (2015 $) |
|---|---|---|
| 2015 | $1,000 | $1,000 |
| 2016 | $994 | $979 |
| 2017 | $1,009 | $972 |
| 2018 | $1,034 | $967 |
| 2019 | $1,060 | $968 |
| 2020 | $1,163 | $1,046 |
| 2021 | $1,218 | $1,043 |
| 2022 | $1,181 | $926 |
| 2023 | $1,083 | $818 |
| 2024 | $1,105 | $811 |
| 2025 | $1,129 | $812 |
| 2026 | $1,204 | $867 |
Inflation adjustment uses BLS CPI-U annual data, deflated to 2026 dollars. Nominal stock data from Yahoo Finance (split-adjusted closing prices). Real values are expressed in constant 2015 purchasing-power dollars. For informational and educational purposes only. Not financial advice. Past performance does not guarantee future results. See our methodology and full disclaimer.