What if you invested $1,000 in TSMC in 2010? (Inflation-Adjusted)
TSM · Technology · Adjusted to 2026 dollars using BLS CPI-U data
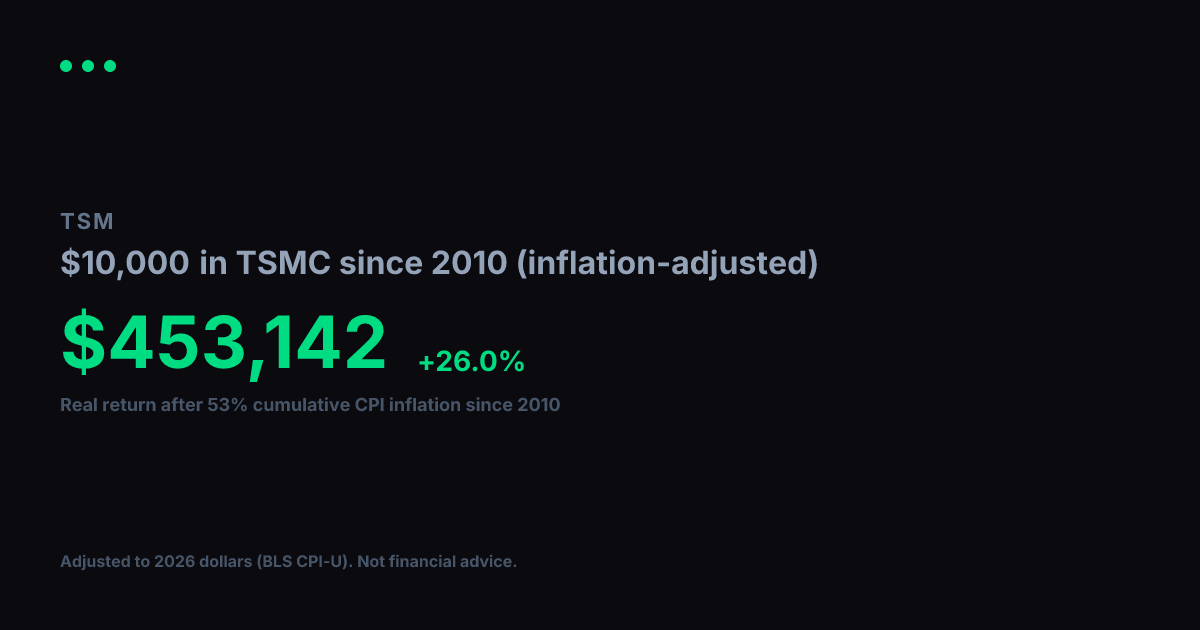
View nominal (non-adjusted) versionTSMC turned $1,000 into $75,226 between 2010 and today. Impressive on paper, but inflation over that span came to 53% (BLS CPI-U). Adjusted for that erosion in purchasing power, your real gain in constant 2010 dollars is $49,167, which works out to a +26.4% annualized real growth rate over 17 years.
Nominal final value
$75,226
+7422.6% total return
Real value (2010 dollars)
$49,167
+4816.7% real total return
Real annualized return
+26.4%
vs. +29.8% nominal annualized
Year-by-Year (Inflation-Adjusted)
$1,000 in TSMC since 2010, values in constant 2010 dollars
| Year | Nominal Value | Real Value (2010 $) |
|---|---|---|
| 2010 | $1,000 | $1,000 |
| 2011 | $1,350 | $1,298 |
| 2012 | $1,516 | $1,427 |
| 2013 | $1,979 | $1,824 |
| 2014 | $1,940 | $1,763 |
| 2015 | $2,663 | $2,419 |
| 2016 | $2,704 | $2,421 |
| 2017 | $3,880 | $3,398 |
| 2018 | $5,873 | $4,990 |
| 2019 | $5,054 | $4,195 |
| 2020 | $7,589 | $6,200 |
| 2021 | $17,552 | $13,652 |
| 2022 | $17,995 | $12,820 |
| 2023 | $13,901 | $9,540 |
| 2024 | $17,263 | $11,509 |
| 2025 | $32,442 | $21,204 |
| 2026 | $51,923 | $33,936 |
Inflation adjustment uses BLS CPI-U annual data, deflated to 2026 dollars. Nominal stock data from Yahoo Finance (split-adjusted closing prices). Real values are expressed in constant 2010 purchasing-power dollars. For informational and educational purposes only. Not financial advice. Past performance does not guarantee future results. See our methodology and full disclaimer.