What if you invested $1,000 in US Aggregate Bond (AGG) in 2010? (Inflation-Adjusted)
AGG · Bond · Adjusted to 2026 dollars using BLS CPI-U data
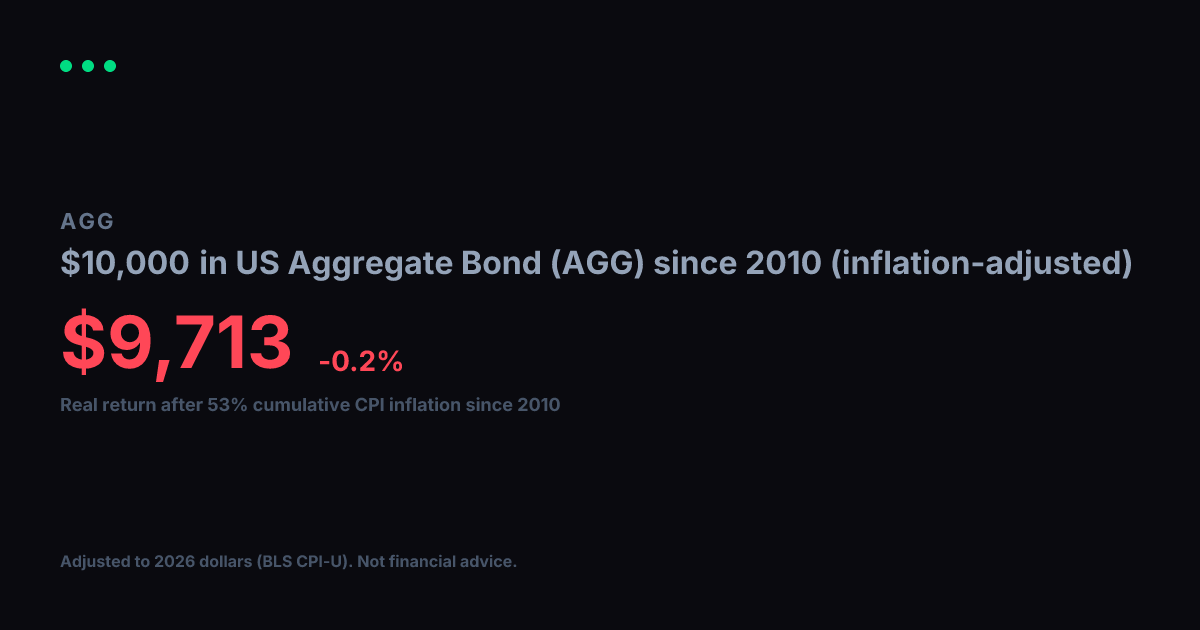
View nominal (non-adjusted) versionUS Aggregate Bond (AGG) turned $1,000 into $1,494 between 2010 and today. Impressive on paper, but inflation over that span came to 53% (BLS CPI-U). Adjusted for that erosion in purchasing power, your real gain in constant 2010 dollars is $976, which works out to a -0.1% annualized real growth rate over 17 years.
Nominal final value
$1,494
+49.4% total return
Real value (2010 dollars)
$976
-2.4% real total return
Real annualized return
-0.1%
vs. +2.4% nominal annualized
Year-by-Year (Inflation-Adjusted)
$1,000 in US Aggregate Bond (AGG) since 2010, values in constant 2010 dollars
| Year | Nominal Value | Real Value (2010 $) |
|---|---|---|
| 2010 | $1,000 | $1,000 |
| 2011 | $1,048 | $1,007 |
| 2012 | $1,138 | $1,071 |
| 2013 | $1,165 | $1,073 |
| 2014 | $1,166 | $1,060 |
| 2015 | $1,243 | $1,129 |
| 2016 | $1,239 | $1,109 |
| 2017 | $1,256 | $1,100 |
| 2018 | $1,283 | $1,090 |
| 2019 | $1,314 | $1,091 |
| 2020 | $1,441 | $1,177 |
| 2021 | $1,506 | $1,172 |
| 2022 | $1,461 | $1,041 |
| 2023 | $1,340 | $920 |
| 2024 | $1,368 | $912 |
| 2025 | $1,395 | $912 |
| 2026 | $1,492 | $975 |
Inflation adjustment uses BLS CPI-U annual data, deflated to 2026 dollars. Nominal stock data from Yahoo Finance (split-adjusted closing prices). Real values are expressed in constant 2010 purchasing-power dollars. For informational and educational purposes only. Not financial advice. Past performance does not guarantee future results. See our methodology and full disclaimer.