What if you invested $1,000 in US Dollar (Cash) in 2000? (Inflation-Adjusted)
USD · Benchmark · Adjusted to 2026 dollars using BLS CPI-U data
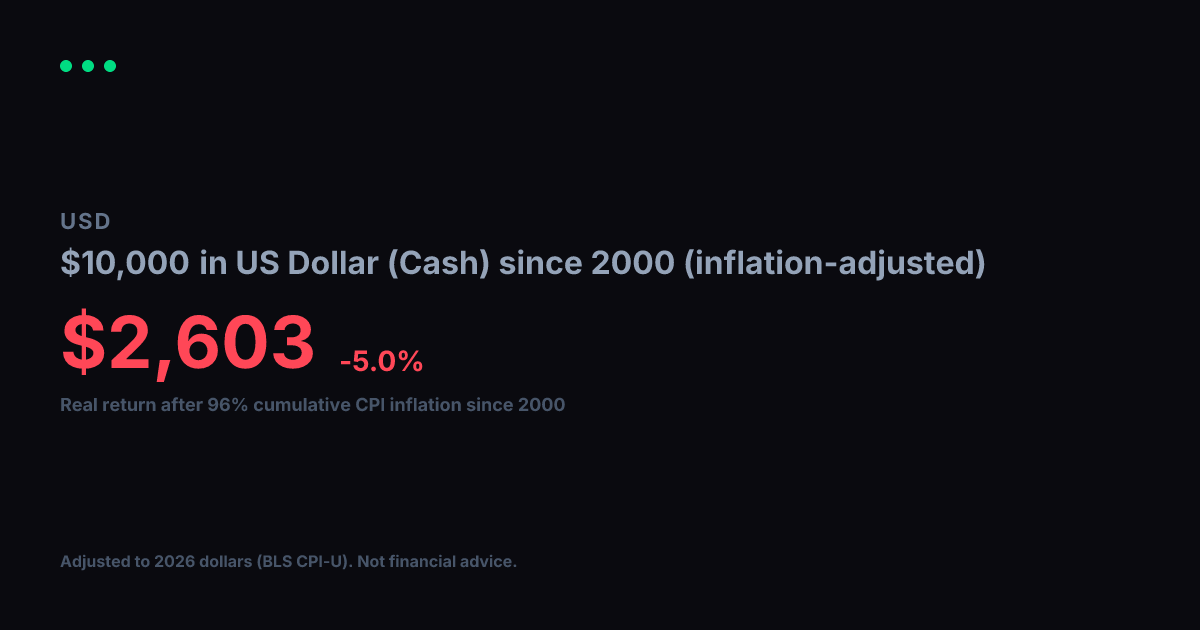
View nominal (non-adjusted) versionA $1,000 investment in US Dollar (Cash) in 2000 grew to $510 in nominal terms. But 2000 dollars had 96% more purchasing power than today. After adjusting for cumulative inflation using BLS CPI-U data, the real value of that growth works out to $260 in constant 2000 dollars, equivalent to a -4.9% real annualized return.
Nominal final value
$510
-49.0% total return
Real value (2000 dollars)
$260
-74.0% real total return
Real annualized return
-4.9%
vs. -2.5% nominal annualized
Year-by-Year (Inflation-Adjusted)
$1,000 in US Dollar (Cash) since 2000, values in constant 2000 dollars
| Year | Nominal Value | Real Value (2000 $) |
|---|---|---|
| 2000 | $1,000 | $1,000 |
| 2001 | $972 | $947 |
| 2002 | $956 | $913 |
| 2003 | $934 | $872 |
| 2004 | $909 | $826 |
| 2005 | $878 | $771 |
| 2006 | $850 | $724 |
| 2007 | $826 | $683 |
| 2008 | $795 | $633 |
| 2009 | $798 | $639 |
| 2010 | $785 | $613 |
| 2011 | $760 | $570 |
| 2012 | $744 | $547 |
| 2013 | $733 | $527 |
| 2014 | $721 | $512 |
| 2015 | $721 | $511 |
| 2016 | $711 | $497 |
| 2017 | $696 | $476 |
| 2018 | $680 | $451 |
| 2019 | $667 | $432 |
| 2020 | $659 | $421 |
| 2021 | $628 | $382 |
| 2022 | $578 | $322 |
| 2023 | $554 | $297 |
| 2024 | $538 | $280 |
| 2025 | $523 | $267 |
| 2026 | $510 | $260 |
Inflation adjustment uses BLS CPI-U annual data, deflated to 2026 dollars. Nominal stock data from Yahoo Finance (split-adjusted closing prices). Real values are expressed in constant 2000 purchasing-power dollars. For informational and educational purposes only. Not financial advice. Past performance does not guarantee future results. See our methodology and full disclaimer.