What if you invested $1,000 in US Dollar (Cash) in 2005? (Inflation-Adjusted)
USD · Benchmark · Adjusted to 2026 dollars using BLS CPI-U data
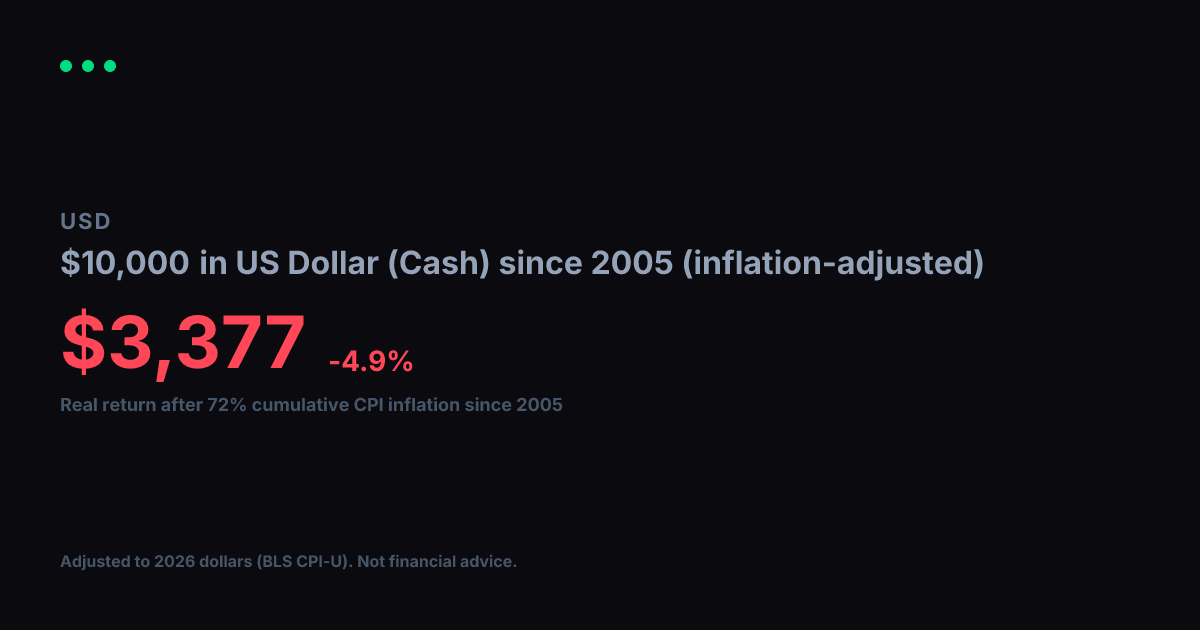
View nominal (non-adjusted) versionUsing BLS CPI-U data, cumulative inflation from 2005 to 2026 totals 72%. Your $1,000 in US Dollar (Cash) grew to $581 in raw dollar terms, but in real purchasing power terms that gain is equivalent to $338 in constant 2005 dollars. That reflects a -4.9% per year real annualized return after accounting for price changes over 22 years.
Nominal final value
$581
-41.9% total return
Real value (2005 dollars)
$338
-66.2% real total return
Real annualized return
-4.9%
vs. -2.5% nominal annualized
Year-by-Year (Inflation-Adjusted)
$1,000 in US Dollar (Cash) since 2005, values in constant 2005 dollars
| Year | Nominal Value | Real Value (2005 $) |
|---|---|---|
| 2005 | $1,000 | $1,000 |
| 2006 | $968 | $940 |
| 2007 | $941 | $886 |
| 2008 | $905 | $821 |
| 2009 | $909 | $830 |
| 2010 | $894 | $795 |
| 2011 | $866 | $740 |
| 2012 | $847 | $709 |
| 2013 | $835 | $684 |
| 2014 | $821 | $664 |
| 2015 | $821 | $663 |
| 2016 | $810 | $645 |
| 2017 | $793 | $618 |
| 2018 | $774 | $585 |
| 2019 | $760 | $561 |
| 2020 | $751 | $546 |
| 2021 | $716 | $495 |
| 2022 | $658 | $417 |
| 2023 | $631 | $385 |
| 2024 | $613 | $364 |
| 2025 | $596 | $346 |
| 2026 | $581 | $338 |
Inflation adjustment uses BLS CPI-U annual data, deflated to 2026 dollars. Nominal stock data from Yahoo Finance (split-adjusted closing prices). Real values are expressed in constant 2005 purchasing-power dollars. For informational and educational purposes only. Not financial advice. Past performance does not guarantee future results. See our methodology and full disclaimer.