What if you invested $1,000 in US Dollar (Cash) in 2010? (Inflation-Adjusted)
USD · Benchmark · Adjusted to 2026 dollars using BLS CPI-U data
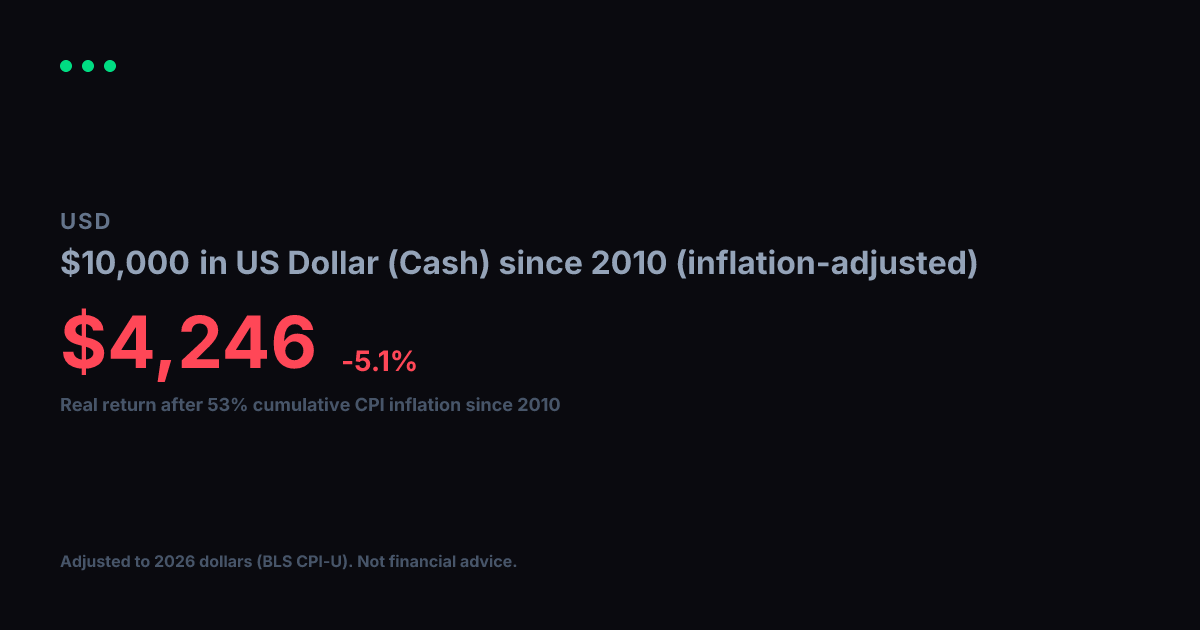
View nominal (non-adjusted) versionUS Dollar (Cash) turned $1,000 into $650 between 2010 and today. Impressive on paper, but inflation over that span came to 53% (BLS CPI-U). Adjusted for that erosion in purchasing power, your real gain in constant 2010 dollars is $425, which works out to a -5.0% annualized real growth rate over 17 years.
Nominal final value
$650
-35.0% total return
Real value (2010 dollars)
$425
-57.5% real total return
Real annualized return
-5.0%
vs. -2.6% nominal annualized
Year-by-Year (Inflation-Adjusted)
$1,000 in US Dollar (Cash) since 2010, values in constant 2010 dollars
| Year | Nominal Value | Real Value (2010 $) |
|---|---|---|
| 2010 | $1,000 | $1,000 |
| 2011 | $968 | $930 |
| 2012 | $948 | $892 |
| 2013 | $933 | $860 |
| 2014 | $919 | $834 |
| 2015 | $918 | $834 |
| 2016 | $906 | $811 |
| 2017 | $887 | $777 |
| 2018 | $865 | $735 |
| 2019 | $850 | $705 |
| 2020 | $840 | $686 |
| 2021 | $800 | $622 |
| 2022 | $736 | $524 |
| 2023 | $706 | $484 |
| 2024 | $685 | $457 |
| 2025 | $666 | $435 |
| 2026 | $650 | $425 |
Inflation adjustment uses BLS CPI-U annual data, deflated to 2026 dollars. Nominal stock data from Yahoo Finance (split-adjusted closing prices). Real values are expressed in constant 2010 purchasing-power dollars. For informational and educational purposes only. Not financial advice. Past performance does not guarantee future results. See our methodology and full disclaimer.