What if you invested $1,000 in US Dollar (Cash) in 2015? (Inflation-Adjusted)
USD · Benchmark · Adjusted to 2026 dollars using BLS CPI-U data
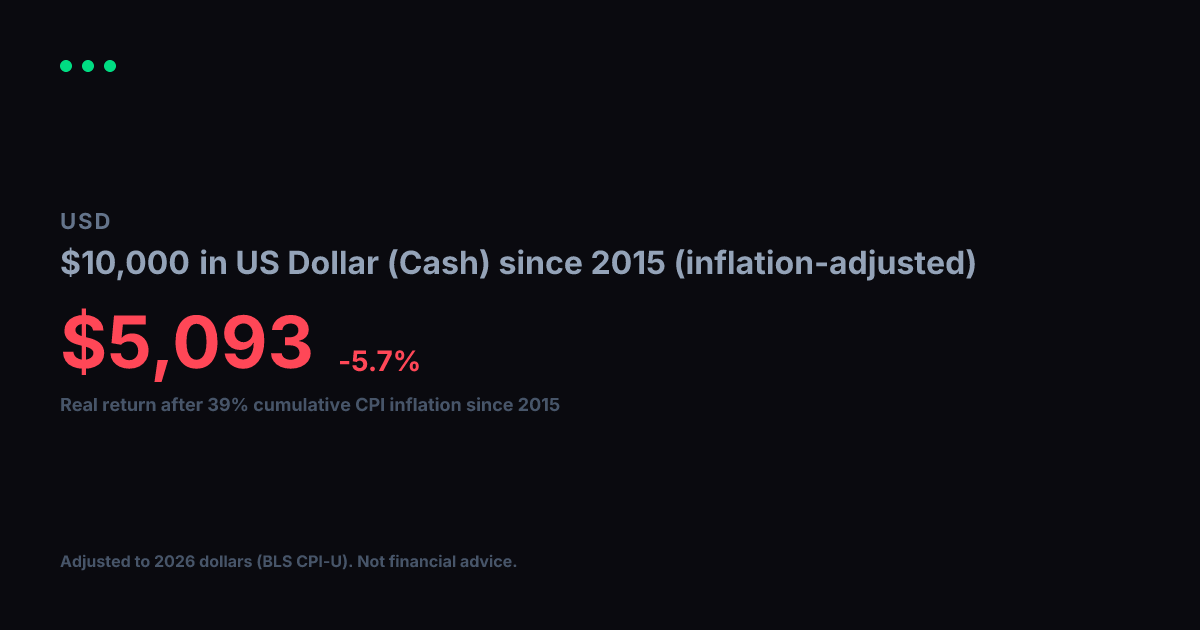
View nominal (non-adjusted) versionNominal returns can be misleading over long periods. $1,000 in US Dollar (Cash) in 2015 became $708 by 2026. Over those 12 years, cumulative CPI inflation reached 39% (BLS CPI-U). Restating the return in constant purchasing power, the real value of your gain in 2015 dollars is $509, a real annualized return of -5.7%.
Nominal final value
$708
-29.2% total return
Real value (2015 dollars)
$509
-49.1% real total return
Real annualized return
-5.7%
vs. -2.9% nominal annualized
Year-by-Year (Inflation-Adjusted)
$1,000 in US Dollar (Cash) since 2015, values in constant 2015 dollars
| Year | Nominal Value | Real Value (2015 $) |
|---|---|---|
| 2015 | $1,000 | $1,000 |
| 2016 | $987 | $973 |
| 2017 | $966 | $932 |
| 2018 | $943 | $882 |
| 2019 | $926 | $846 |
| 2020 | $915 | $823 |
| 2021 | $872 | $747 |
| 2022 | $802 | $629 |
| 2023 | $769 | $581 |
| 2024 | $747 | $548 |
| 2025 | $726 | $522 |
| 2026 | $708 | $509 |
Inflation adjustment uses BLS CPI-U annual data, deflated to 2026 dollars. Nominal stock data from Yahoo Finance (split-adjusted closing prices). Real values are expressed in constant 2015 purchasing-power dollars. For informational and educational purposes only. Not financial advice. Past performance does not guarantee future results. See our methodology and full disclaimer.