What if you invested $1,000 in Verizon in 2010? (Inflation-Adjusted)
VZ · Technology · Adjusted to 2026 dollars using BLS CPI-U data
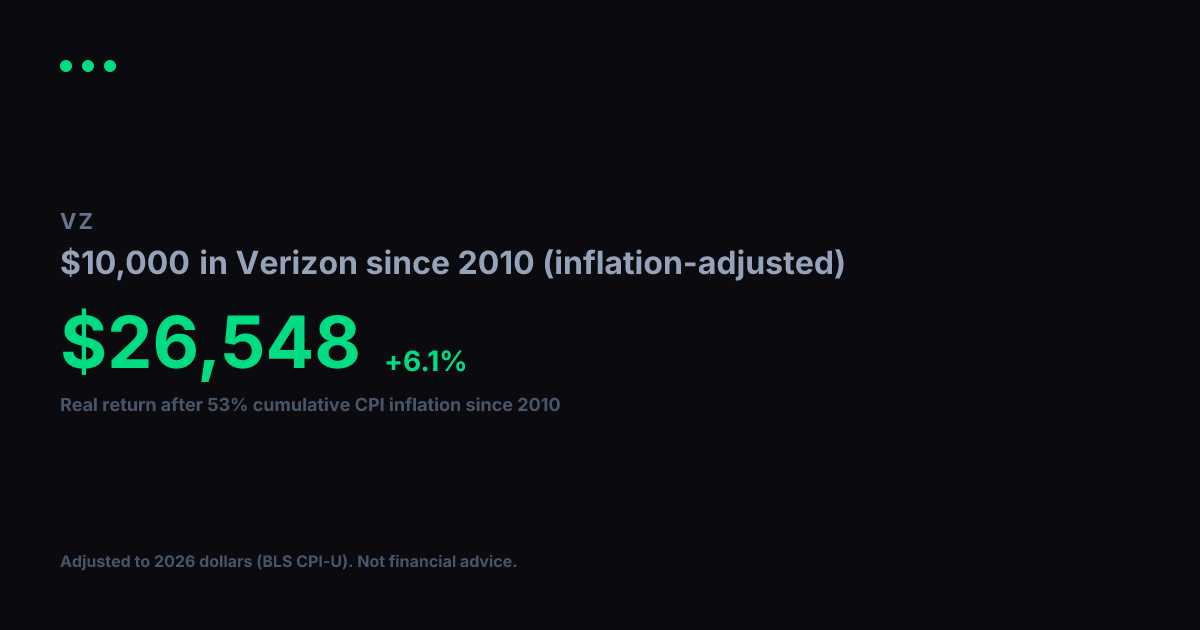
View nominal (non-adjusted) versionVerizon turned $1,000 into $3,597 between 2010 and today. Impressive on paper, but inflation over that span came to 53% (BLS CPI-U). Adjusted for that erosion in purchasing power, your real gain in constant 2010 dollars is $2,351, which works out to a +5.3% annualized real growth rate over 17 years.
Nominal final value
$3,597
+259.7% total return
Real value (2010 dollars)
$2,351
+135.1% real total return
Real annualized return
+5.3%
vs. +8% nominal annualized
Year-by-Year (Inflation-Adjusted)
$1,000 in Verizon since 2010, values in constant 2010 dollars
| Year | Nominal Value | Real Value (2010 $) |
|---|---|---|
| 2010 | $1,000 | $1,000 |
| 2011 | $1,374 | $1,320 |
| 2012 | $1,531 | $1,441 |
| 2013 | $1,861 | $1,715 |
| 2014 | $2,140 | $1,944 |
| 2015 | $2,128 | $1,933 |
| 2016 | $2,439 | $2,184 |
| 2017 | $2,501 | $2,190 |
| 2018 | $2,893 | $2,458 |
| 2019 | $3,086 | $2,561 |
| 2020 | $3,472 | $2,837 |
| 2021 | $3,338 | $2,596 |
| 2022 | $3,392 | $2,417 |
| 2023 | $2,794 | $1,918 |
| 2024 | $3,056 | $2,037 |
| 2025 | $3,032 | $1,981 |
| 2026 | $3,662 | $2,394 |
Inflation adjustment uses BLS CPI-U annual data, deflated to 2026 dollars. Nominal stock data from Yahoo Finance (split-adjusted closing prices). Real values are expressed in constant 2010 purchasing-power dollars. For informational and educational purposes only. Not financial advice. Past performance does not guarantee future results. See our methodology and full disclaimer.