What if you invested $1,000 in Vistra in 2017? (Inflation-Adjusted)
VST · Energy · Adjusted to 2026 dollars using BLS CPI-U data
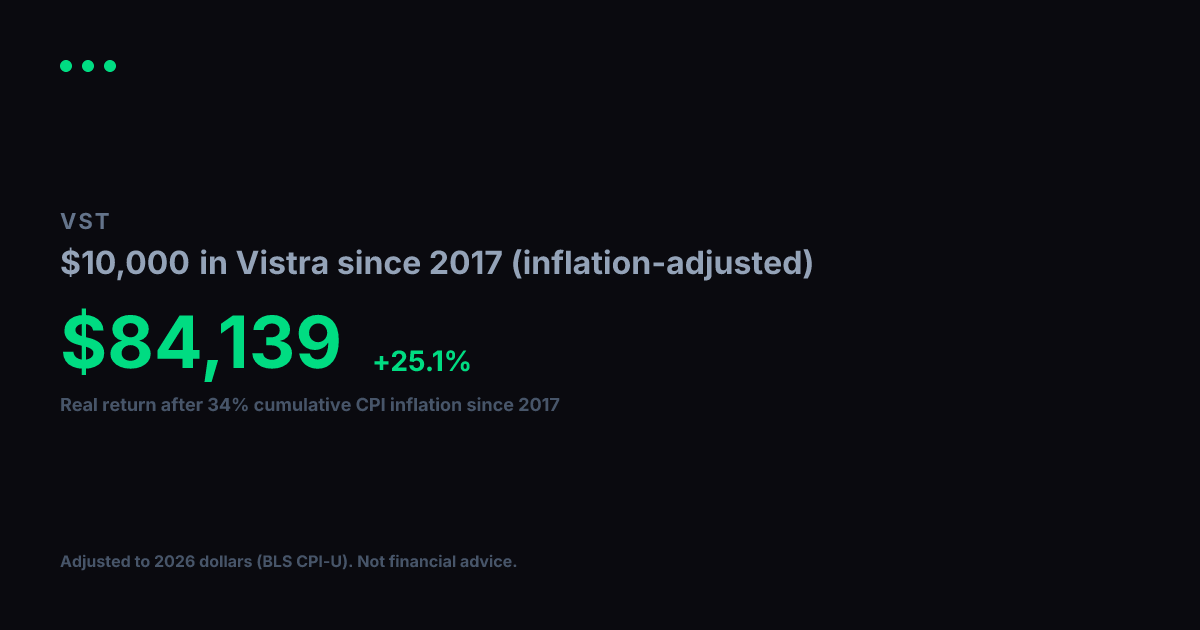
View nominal (non-adjusted) versionUsing BLS CPI-U data, cumulative inflation from 2017 to 2026 totals 34%. Your $1,000 in Vistra grew to $11,456 in raw dollar terms, but in real purchasing power terms that gain is equivalent to $8,549 in constant 2017 dollars. That reflects a +25.0% per year real annualized return after accounting for price changes over 10 years.
Nominal final value
$11,456
+1045.6% total return
Real value (2017 dollars)
$8,549
+754.9% real total return
Real annualized return
+25.0%
vs. +29% nominal annualized
Year-by-Year (Inflation-Adjusted)
$1,000 in Vistra since 2017, values in constant 2017 dollars
| Year | Nominal Value | Real Value (2017 $) |
|---|---|---|
| 2017 | $1,000 | $1,000 |
| 2018 | $1,203 | $1,167 |
| 2019 | $1,549 | $1,468 |
| 2020 | $1,417 | $1,322 |
| 2021 | $1,295 | $1,150 |
| 2022 | $1,460 | $1,188 |
| 2023 | $1,592 | $1,248 |
| 2024 | $2,914 | $2,218 |
| 2025 | $12,052 | $8,994 |
| 2026 | $11,420 | $8,523 |
Inflation adjustment uses BLS CPI-U annual data, deflated to 2026 dollars. Nominal stock data from Yahoo Finance (split-adjusted closing prices). Real values are expressed in constant 2017 purchasing-power dollars. For informational and educational purposes only. Not financial advice. Past performance does not guarantee future results. See our methodology and full disclaimer.