What if you invested $1,000 in Walmart in 2010? (Inflation-Adjusted)
WMT · Consumer · Adjusted to 2026 dollars using BLS CPI-U data
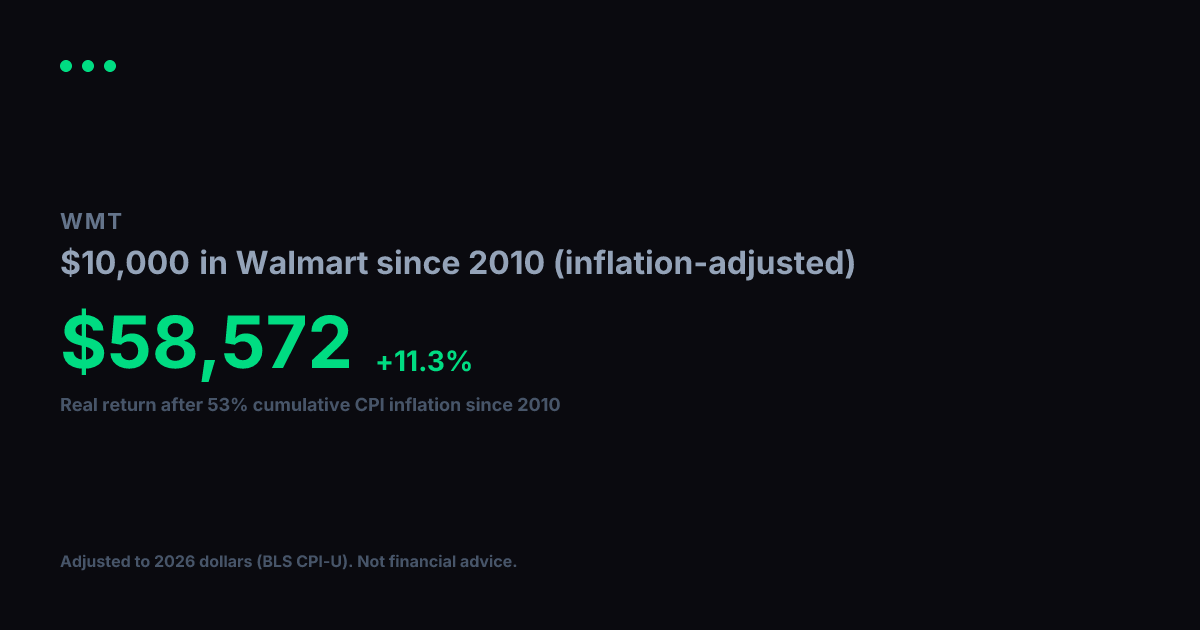
View nominal (non-adjusted) versionWalmart turned $1,000 into $8,905 between 2010 and today. Impressive on paper, but inflation over that span came to 53% (BLS CPI-U). Adjusted for that erosion in purchasing power, your real gain in constant 2010 dollars is $5,820, which works out to a +11.2% annualized real growth rate over 17 years.
Nominal final value
$8,905
+790.5% total return
Real value (2010 dollars)
$5,820
+482.0% real total return
Real annualized return
+11.2%
vs. +14.1% nominal annualized
Year-by-Year (Inflation-Adjusted)
$1,000 in Walmart since 2010, values in constant 2010 dollars
| Year | Nominal Value | Real Value (2010 $) |
|---|---|---|
| 2010 | $1,000 | $1,000 |
| 2011 | $1,074 | $1,031 |
| 2012 | $1,207 | $1,136 |
| 2013 | $1,410 | $1,299 |
| 2014 | $1,542 | $1,401 |
| 2015 | $1,799 | $1,634 |
| 2016 | $1,444 | $1,293 |
| 2017 | $1,494 | $1,309 |
| 2018 | $2,448 | $2,080 |
| 2019 | $2,253 | $1,870 |
| 2020 | $2,747 | $2,244 |
| 2021 | $3,426 | $2,665 |
| 2022 | $3,464 | $2,468 |
| 2023 | $3,621 | $2,485 |
| 2024 | $4,222 | $2,815 |
| 2025 | $7,614 | $4,977 |
| 2026 | $9,330 | $6,098 |
Inflation adjustment uses BLS CPI-U annual data, deflated to 2026 dollars. Nominal stock data from Yahoo Finance (split-adjusted closing prices). Real values are expressed in constant 2010 purchasing-power dollars. For informational and educational purposes only. Not financial advice. Past performance does not guarantee future results. See our methodology and full disclaimer.