What if you invested $1,000 in Wells Fargo in 2010? (Inflation-Adjusted)
WFC · Financial · Adjusted to 2026 dollars using BLS CPI-U data
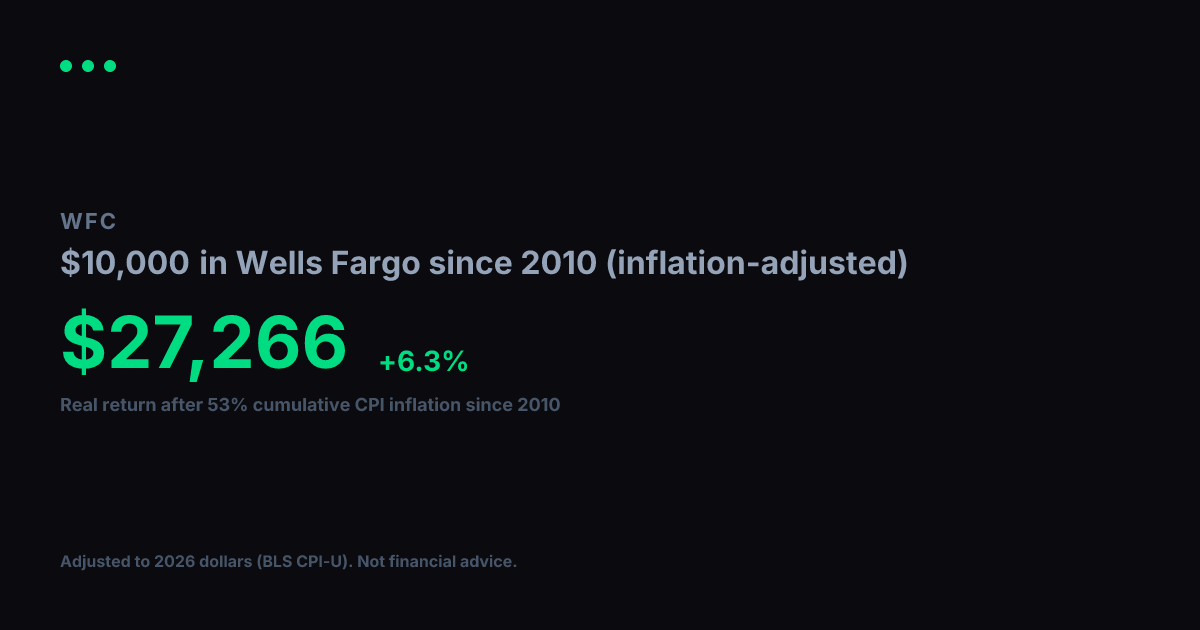
View nominal (non-adjusted) versionWells Fargo turned $1,000 into $4,452 between 2010 and today. Impressive on paper, but inflation over that span came to 53% (BLS CPI-U). Adjusted for that erosion in purchasing power, your real gain in constant 2010 dollars is $2,910, which works out to a +6.6% annualized real growth rate over 17 years.
Nominal final value
$4,452
+345.2% total return
Real value (2010 dollars)
$2,910
+191.0% real total return
Real annualized return
+6.6%
vs. +9.4% nominal annualized
Year-by-Year (Inflation-Adjusted)
$1,000 in Wells Fargo since 2010, values in constant 2010 dollars
| Year | Nominal Value | Real Value (2010 $) |
|---|---|---|
| 2010 | $1,000 | $1,000 |
| 2011 | $1,148 | $1,103 |
| 2012 | $1,052 | $991 |
| 2013 | $1,289 | $1,188 |
| 2014 | $1,727 | $1,569 |
| 2015 | $2,032 | $1,846 |
| 2016 | $2,019 | $1,808 |
| 2017 | $2,337 | $2,047 |
| 2018 | $2,807 | $2,385 |
| 2019 | $2,148 | $1,783 |
| 2020 | $2,144 | $1,752 |
| 2021 | $1,420 | $1,104 |
| 2022 | $2,591 | $1,846 |
| 2023 | $2,310 | $1,585 |
| 2024 | $2,551 | $1,701 |
| 2025 | $4,111 | $2,687 |
| 2026 | $4,824 | $3,153 |
Inflation adjustment uses BLS CPI-U annual data, deflated to 2026 dollars. Nominal stock data from Yahoo Finance (split-adjusted closing prices). Real values are expressed in constant 2010 purchasing-power dollars. For informational and educational purposes only. Not financial advice. Past performance does not guarantee future results. See our methodology and full disclaimer.