What if you invested in Hims & Hers in 2023?
HIMS · Healthcare · Data through 2026-10-01
If you invested $1,000 in Hims & Hers in 2023
The same $1,000 in the S&P 500 would be worth $1,963(+96.3%)
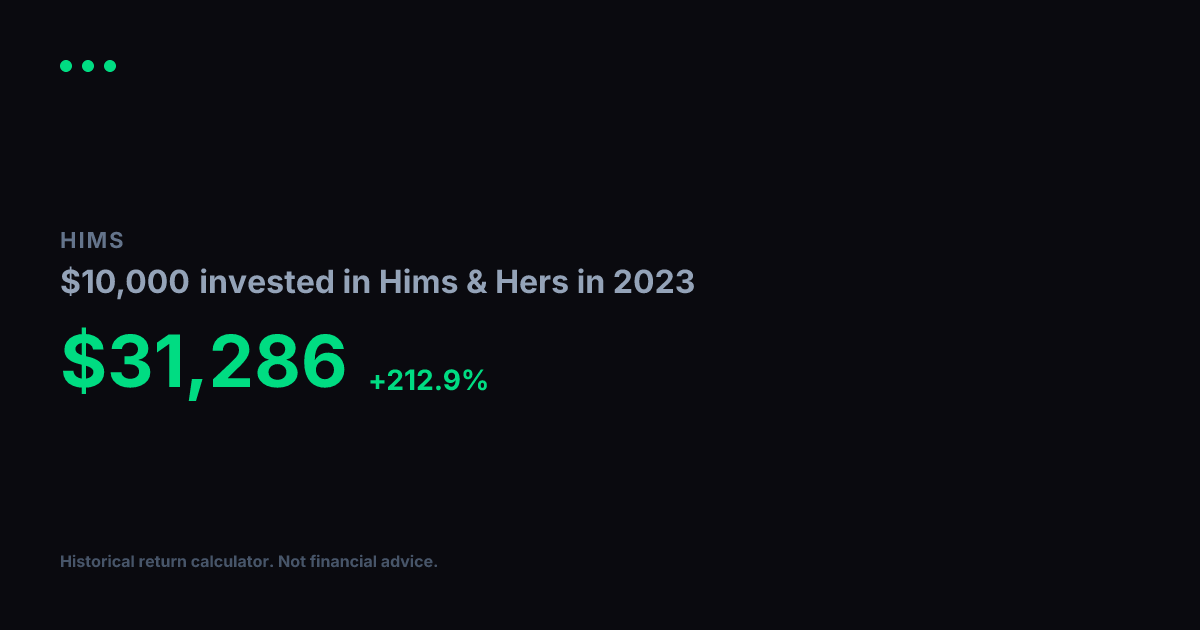
The S&P 500 returned $1,963 on the same $1,000. Hims & Hers beat the market by $1,552.
Try a different start date
Pick any month and year to see what Hims & Hers would be worth.
Compare Hims & Hers to another stock
See how Hims & Hers stacks up since 2023, head to head.
What if Hims & Hers keeps this up?
Project forward at Hims & Hers's 38.8% historical growth rate. See 5-30 year scenarios.
Growth of $1,000
Hims & Hers vs. S&P 500 vs. US Dollar, 2023 to present
Year-by-Year Returns
$1,000 invested in Hims & Hers starting January 2023
| Year | Price | Value | Annual |
|---|---|---|---|
| 2023 | $8.28 | $1,000 | - |
| 2024 | $8.58 | $1,036 | +3.6% |
| 2025 | $37.28 | $4,502 | +334.5% |
| 2026 | $27.09 | $3,272 | -27.3% |
What this return means
Putting $1,000 into Hims & Hers (HIMS) in 2023 returned $3,515. That is a +251.5% gain, a little over 3.5x your money, measured to 2026-10-01.
That is a compound rate of about 38.8% a year, an extreme pace that few holdings sustain for 3.8 years. A plain S&P 500 fund would have turned that $1,000 into about $1,963 instead, leaving Hims & Hers ahead by around $1,552. The index compounded at about 19.2% a year over that period.
The year-by-year record shows how bumpy the ride was. The best single year was 2025 at +334.5%, and the worst was 2024 at +3.6%. At its lowest point the position was down about 27% from an earlier high. These figures use split-adjusted closing prices and exclude dividends, taxes, trading fees, and inflation, so a real after-tax result would differ.
This is historical math, not financial advice. Past performance does not guarantee future results.
What if you invested $100 a month instead?
Most people do not drop a lump sum in on day one. They add a fixed amount every month. Putting $100 into Hims & Hers at the close of every month from January 2023 through October 2026 means 46 buys and $4,600 contributed over about 3.8 years.
$100/month, dollar-cost averaged
$8,266
+79.7% on $4,600 in
Same $4,600, all in at the start
$16,167
+251.4% on $4,600 in
Going all in at the start beat spreading the buys out by $7,901. That is the usual result when a stock trends up: each monthly buy pays a higher price than the last, so the average cost climbs. Averaging in also meant an average buy price of $16.19 per share across the whole stretch, so the monthly buyer never had to time a single low. Neither number counts dividends, taxes, or trading costs.
Illustrative fixed $100/month example, not a recommendation. Figures are computed from HIMS split-adjusted monthly closes through October 2026. Past performance does not guarantee future results.
More Healthcare investments
Compare returns across the sector
Related reading
Deep dives and analysis
Numbers worth sharing
Occasional data drops when something interesting surfaces. No schedule, just signal.
For informational and educational purposes only. Not financial advice. Past performance does not guarantee future results. All calculations are based on split-adjusted closing prices from Yahoo Finance and do not account for dividends, taxes, or trading fees. See our methodology and full disclaimer.