What if you invested $1,000 in Nike in 2000? (Inflation-Adjusted)
NKE · Consumer · Adjusted to 2026 dollars using BLS CPI-U data
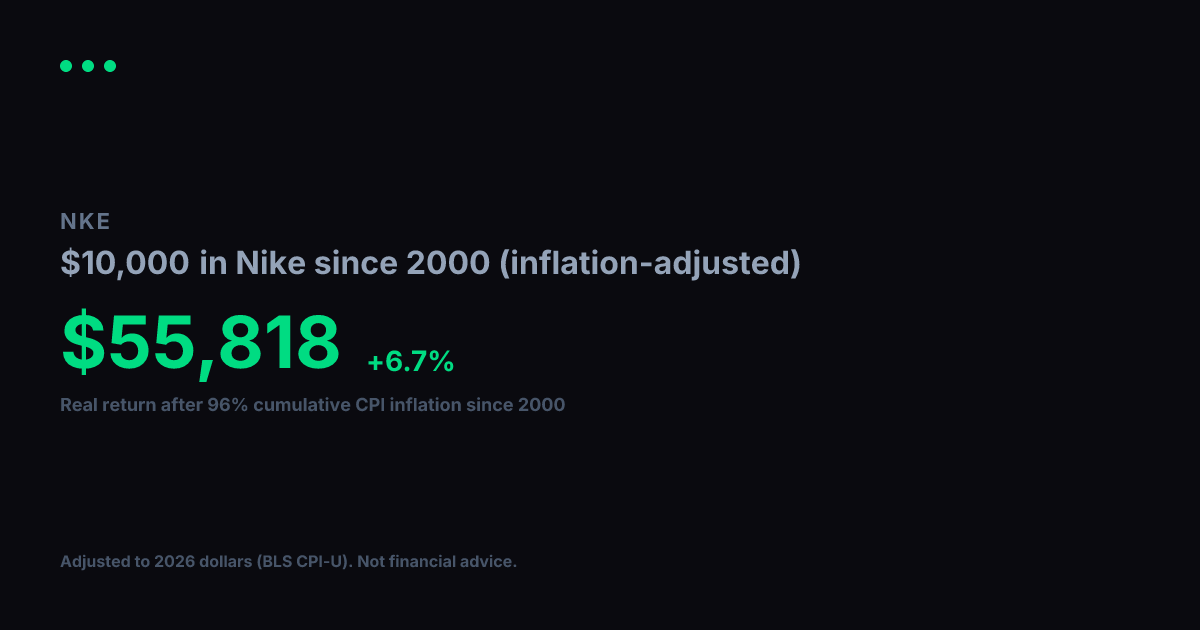
View nominal (non-adjusted) versionA $1,000 investment in Nike in 2000 grew to $9,862 in nominal terms. But 2000 dollars had 96% more purchasing power than today. After adjusting for cumulative inflation using BLS CPI-U data, the real value of that growth works out to $5,032 in constant 2000 dollars, equivalent to a +6.3% real annualized return.
Nominal final value
$9,862
+886.2% total return
Real value (2000 dollars)
$5,032
+403.2% real total return
Real annualized return
+6.3%
vs. +9% nominal annualized
Year-by-Year (Inflation-Adjusted)
$1,000 in Nike since 2000, values in constant 2000 dollars
| Year | Nominal Value | Real Value (2000 $) |
|---|---|---|
| 2000 | $1,000 | $1,000 |
| 2001 | $1,217 | $1,186 |
| 2002 | $1,332 | $1,271 |
| 2003 | $996 | $930 |
| 2004 | $1,566 | $1,422 |
| 2005 | $1,958 | $1,718 |
| 2006 | $1,841 | $1,569 |
| 2007 | $2,264 | $1,871 |
| 2008 | $2,844 | $2,264 |
| 2009 | $2,132 | $1,708 |
| 2010 | $3,061 | $2,390 |
| 2011 | $4,021 | $3,015 |
| 2012 | $5,144 | $3,779 |
| 2013 | $5,426 | $3,903 |
| 2014 | $7,414 | $5,258 |
| 2015 | $9,502 | $6,739 |
| 2016 | $12,911 | $9,024 |
| 2017 | $11,145 | $7,620 |
| 2018 | $14,565 | $9,661 |
| 2019 | $17,679 | $11,455 |
| 2020 | $21,013 | $13,401 |
| 2021 | $29,427 | $17,867 |
| 2022 | $32,862 | $18,275 |
| 2023 | $28,563 | $15,301 |
| 2024 | $23,070 | $12,006 |
| 2025 | $17,773 | $9,068 |
| 2026 | $14,621 | $7,460 |
Inflation adjustment uses BLS CPI-U annual data, deflated to 2026 dollars. Nominal stock data from Yahoo Finance (split-adjusted closing prices). Real values are expressed in constant 2000 purchasing-power dollars. For informational and educational purposes only. Not financial advice. Past performance does not guarantee future results. See our methodology and full disclaimer.