What if you invested $1,000 in S&P 500 (SPY) in 2000? (Inflation-Adjusted)
SPY · Index · Adjusted to 2026 dollars using BLS CPI-U data
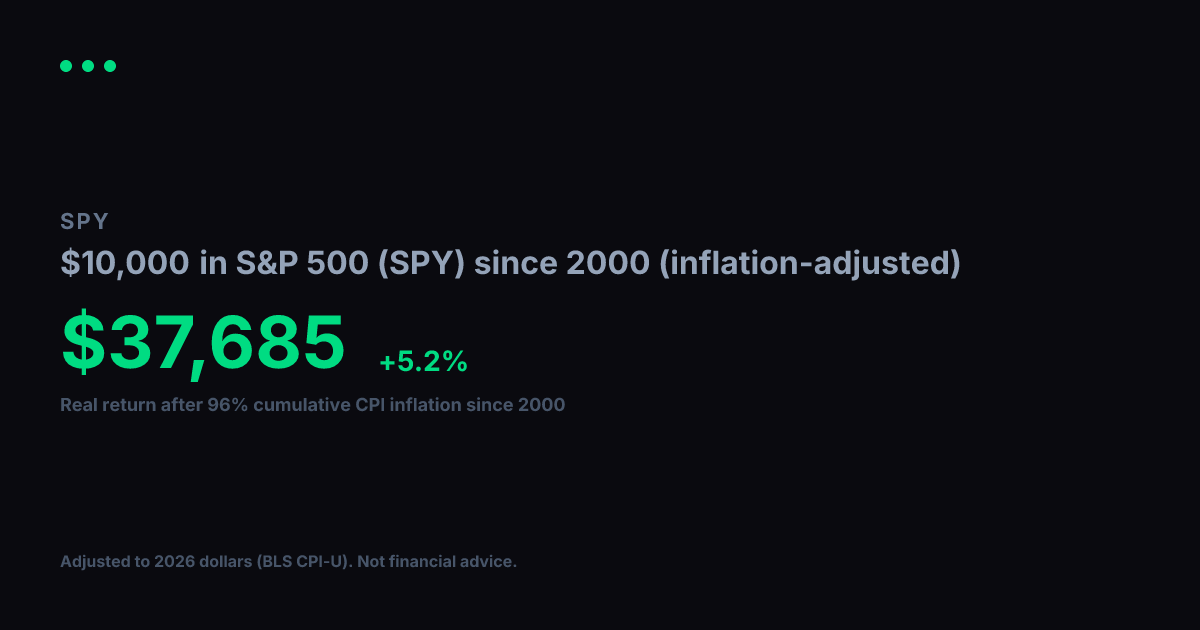
View nominal (non-adjusted) versionA $1,000 investment in S&P 500 (SPY) in 2000 grew to $8,517 in nominal terms. But 2000 dollars had 96% more purchasing power than today. After adjusting for cumulative inflation using BLS CPI-U data, the real value of that growth works out to $4,346 in constant 2000 dollars, equivalent to a +5.7% real annualized return.
Nominal final value
$8,517
+751.7% total return
Real value (2000 dollars)
$4,346
+334.6% real total return
Real annualized return
+5.7%
vs. +8.4% nominal annualized
Year-by-Year (Inflation-Adjusted)
$1,000 in S&P 500 (SPY) since 2000, values in constant 2000 dollars
| Year | Nominal Value | Real Value (2000 $) |
|---|---|---|
| 2000 | $1,000 | $1,000 |
| 2001 | $992 | $967 |
| 2002 | $830 | $792 |
| 2003 | $641 | $599 |
| 2004 | $859 | $780 |
| 2005 | $912 | $800 |
| 2006 | $1,001 | $853 |
| 2007 | $1,150 | $950 |
| 2008 | $1,119 | $891 |
| 2009 | $691 | $553 |
| 2010 | $916 | $715 |
| 2011 | $1,120 | $840 |
| 2012 | $1,167 | $857 |
| 2013 | $1,359 | $978 |
| 2014 | $1,651 | $1,171 |
| 2015 | $1,884 | $1,336 |
| 2016 | $1,868 | $1,305 |
| 2017 | $2,241 | $1,532 |
| 2018 | $2,830 | $1,877 |
| 2019 | $2,761 | $1,789 |
| 2020 | $3,353 | $2,139 |
| 2021 | $3,929 | $2,386 |
| 2022 | $4,841 | $2,692 |
| 2023 | $4,444 | $2,381 |
| 2024 | $5,360 | $2,789 |
| 2025 | $6,766 | $3,452 |
| 2026 | $7,871 | $4,016 |
Inflation adjustment uses BLS CPI-U annual data, deflated to 2026 dollars. Nominal stock data from Yahoo Finance (split-adjusted closing prices). Real values are expressed in constant 2000 purchasing-power dollars. For informational and educational purposes only. Not financial advice. Past performance does not guarantee future results. See our methodology and full disclaimer.